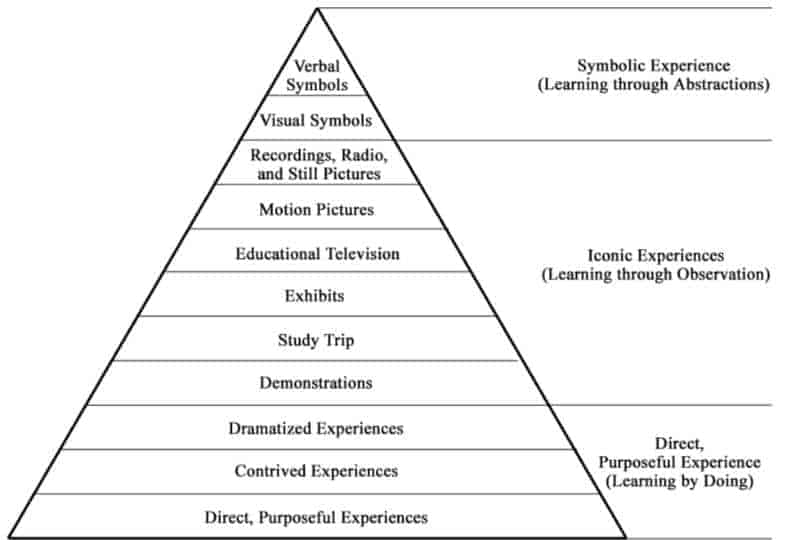
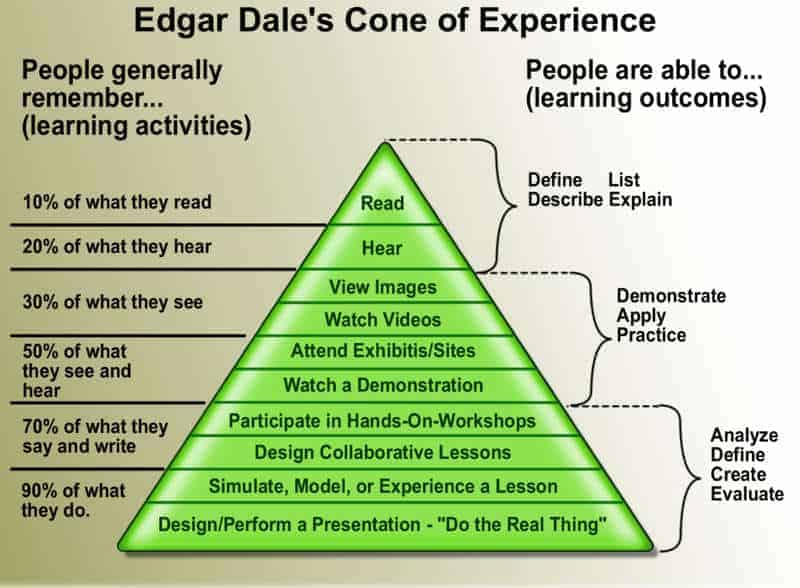
As a teacher or as a constant learner you might have come across what is called the “learning pyramid”, the “cone of experience” or the ” active learning pyramid ” with various numbers of retention depending on the learning style.
But is the learning pyramid accurate? The percentages and order within the learning pyramid are not based on sufficient scientific evidence hence the numbers and the model itself are not accurate.
So why are these numbers not accurate? They clearly sound plausible – the more you interact with a subject the better you will remember it.
What is the learning pyramid and why is it wrong?
To understand how the learning pyramid came into existence let’s take a look at exactly what it is and how it was created: A similar version of what we know today appeared in a book published in 1946 by Edgar Dale called “Audio-Visual Methods in teaching“. Surprisingly the original version did not contain any retention rates and even a later edition from 1969 just integrated the three modes of learning (Bruner 1966) into the cone.

This original version of the learning pyramid according to Dale was meant as a “visual analogy to show the progression of learning” rather than a recipe for improved learning.
You probably know another type of learning pyramid like the one found on Wikipedia. Surprisingly even the Wikipedia page shows a picture with the made-up retention values:

So where did the retention rates come from you see in nearly every image when you type learning pyramid into your favorite search engine?
The origin of the bogus cone of experience
The origin of the numbers doesn’t seem to be entirely clear. Some say the numbers were fabricated by petroleum industry trainers in the 60s. D.G. Teichler (A Mobil Oil affiliate) published his version of the Learning Pyramid in 1967 in the magazine Film and audio-visual communication with the following numbers:
- 10% of what they read
- 20% of what they hear
- 30% of what they see
- 50% of what they hear & see
- 70% of what they say
- 90% of what they say as they do a thing
Most of the time the “Cone of experience” is credited to the NTL (National Training Laboratories) Institute. They originally stated that
- 90% of what they learn when they teach someone else/use immediately.
- 75% of what they learn when they practice what they learned.
- 50% of what they learn when engaged in a group discussion.
- 30% of what they learn when they see a demonstration.
- 20% of what they learn from audiovisual.
- 10% of what they learn when they’ve learned from reading.
- 5% of what they learn when they’ve learned from lecture.
(NTL Institute, Personal Communication, October 14. 2009 )
According to a publication by Kare Letrud the NTL claims to have conducted several studies and tests that confirm the numbers. Unfortunately, NTL says that the original studies could not be found anymore. In conclusion, this means that the numbers are made up and no study so far could produce credible retention rates. Letrud was correct in her observation that those numbers nowadays can not easily be applied anymore even if they were supported by research because modern forms of learning often include a combination of learning styles. Simply watching a YouTube video tutorial to follow along including subtitles nearly has all of the above categories. Additionally comparing the two lists above shows that there seems to be no consense on what the numbers really are.
Why do people still believe in the learning pyramid?
The way people learn new things is complex and depends on individual skills, experience, and habits. Assuming that all students retain information the same way and putting a percentage value to the way they study and memorize material is an attempt to a one size fits all approach that is not supported by science. The reason why we keep on believing in the learning cone is that it looks simple and easy and even sound logical when you first see it. So there is not really a reason to question it, it looks scientific and when you search the internet you find thousand of pyramids. So it must be true. I believed it for many years and tried to figure out how to interact with my study material in all the ways depicted in the pyramid. Needless to say that the extra effort made my learning rather harder than easier. Only after I figured out what methods best suits me and my personal learning style it was so much easier to retain new information. My family thanked me because I stopped trying to teach them stuff they were not interested in at all.
So is there no truth at all in the cone of experience?
If you omit the percentages and do not view the pyramid as a strict hierarchy the idea that interacting with study material in different ways can increase retention rates is definitely true. Rather than thinking of “one method is better than the other” a good combination seems much more effective. For example, once you read something take notes, probably record important key items. Try to repeat things in your own words. I personally try to organize new study material by putting it into a mind map to get the “big picture”. Additionally most of the time I create a cheat sheet that forces me to summarize the essential information. Though I never used a cheat sheet during a test just the feeling that I have all I need to know in my pocket certainly had a calming effect during the exam.
So what should you do instead to increase retention rates?
- Read new material effectively (e.g. with the OPIR method I describe here)
- Take structure notes
- Wath a relevant video if available
- Create a mind map
- Create a cheat sheet
- Make sure your environment is study-friendly (light, color, desk placement, sound)
- Treat yourself well (Posture, food, breaks, exercise)
- Learn how to learn (books, conditioning, breathing)
As you can see, there are so many factors that can influence your learning. Work on these details and forget the bogus cone of learning.
Related questions
What is the evidence or study pyramid? Sometimes confused, the evidence pyramid has nothing to do with the learning pyramid above. The levels of evidence pyramid provides a way to visualize both the quality of evidence and the amount of evidence available. You can read about it in the article from the academicguides.
